Articles/News
: temperature, CO2 concentration and arctic melting")
Climate Change (June 2018): temperature, CO2 concentration and arctic melting
Climate Change has given birth to a big, global debate over the past 30-40 years. Although the scientific community, thanks to the numerous reports by the IPCC (Intergovernmental Panel on Climate Change), agrees on the facts that 1) climate change exists, 2) climate change is caused by anthropogenic factors (by humans), 3) Climate change over the last 200 years has accelerated considerably (it is estimated that Cliamate Change is 170 times faster than in pre-industrial times), there are still people who deny these statements; they claims that climate change is natural and we cannot do anything to change the course of events. This article proposes an analysis of the three major measures (consequences/results) of Climate Change (CO2 concentration in the atmosphere, Global temperature, Arctic ice extent). It’s interesting to note that these three measures converge in one direction: Earth moves towards overheating with tight rhythms.
(by Dario Ruggiero)
CO2 concentration in the atmosphere
Climate change is one of the most important and impending challenges for humanity. Understanding the driving factors of global warming is a starting (and key) point in order to address correctly this challenge. One of these factors is CO2 concentration in the atmosphere (not to confuse with CO2 annual emissions in the atmosphere). In fact, according to the record of CO2 and temperature preserved in ice sheets in Antarctica and Greenland, there is a clear correlation between CO2 concentration in the atmosphere and air temperature (the higher the concentration, the higher air temperature will be).
CO2 concentration in the atmosphere is measured in part per million (ppm). The observations are made in 4 centres by the Global Greenhouse Gas Reference Network. The most important one (often taken as a point of reference) is Mauna Loa (the site chosen by Charles D. Keeling, the scientist who started the studies on the proportion of carbon dioxide in the atmosphere).
The May 9th 2013 figure is extremely significant as CO2 concentration at the Mauna Loa Observatory reached (for the first time since the beginning of recording) 400 parts per million (ppm). It is a high value, considering that it was 280 ppm in the pre-industrial era. After the peak reached in May, considering seasonality, data gradually reduced till the minimum in September 2013. Then CO2 concentration recovered again, and, year after year has reached new peaks. The latest one in the second week of May 2018 at 411.9 ppm.
Now let’s give a look at the latest data available. In the fourth week of June 2018, CO2 concentration was 410.6 ppm, much higher than the level observed in the fourth week of June 2017 (407.7) and of June 2016 (406.0).
If we make a year on year comparison of the fourth week of each month, an average increase of 2.6 ppm has been recorded during the last 3 years (see the table).
Graph – CO2 concentration in the atmosphere
(in ppm, at Mauna Loa, weekly data)
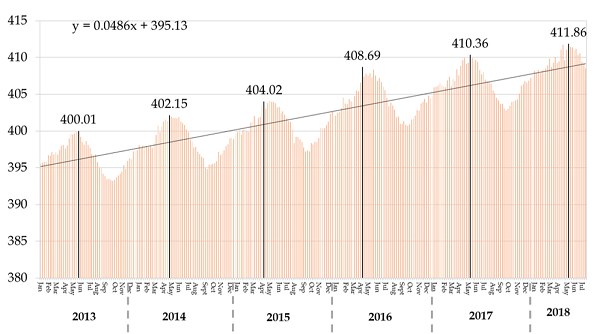
Source: LTEconomy (www.lteconomy.it) – elaboration on ESRL-NOAA data
For further information, pease see the article FOCUS – Co2 concentration in the atmosphere: are we resembling the Pliocene Era? And the interview with Pieter Tans, both published on www.lteconomy.it.
Global Temperature
Data confirms another very hot June and on going global warming. The graph below is clear. For more than five years monthly temperature have been higher than the historical average. And June 2018 confirms the trend, being the ten warmest June on record.
More precisely, according to the NOAA Climate National Climate Data Center, the globally-averaged temperature across land and ocean surfaces was the fifth highest on record for June at 0.75°C (1.35°F) above the 20th century average of 15.5°C (59.9°F). The ten warmest Junes on record have occurred since 2005, with 2016 the warmest June at +0.91°C (+1.64°F). June 2018 also marks the 42nd consecutive June and the 402nd consecutive month with temperatures, at least nominally, above the 20th century average.
The first half of 2018 was characterized by warmer- to much-warmer-than-average conditions across much of the world’s land and ocean surfaces. Record warmth was present across portions of the global oceans as well as parts of the Mediterranean Sea and surrounding areas. New Zealand and small areas across North America, Asia and Australia also had record warm year-to-date temperatures. Averaged as a whole, the combined land and ocean surface temperature for the globe during January–June 2018 was 0.77°C (1.39°F) above the 20th century average and the fourth highest since global records began in 1880.
Graph – Monthly Temperature Anomalies in in 2012-2018
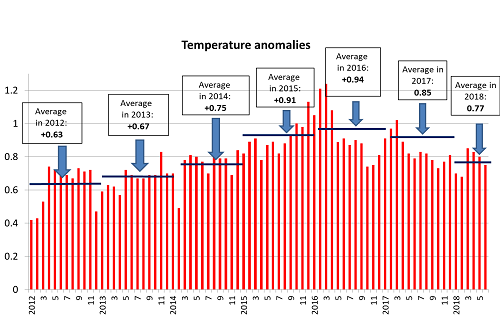
Source: LTEconomy, elaboration on NOAA National Climate Data Center
For further information, please see the article: GLOBAL TEMPERATURE: anomalies go on – December 2017, the third highest December temperature in the 138-year record on www.lteconomy.it
Arctic Ice Extent
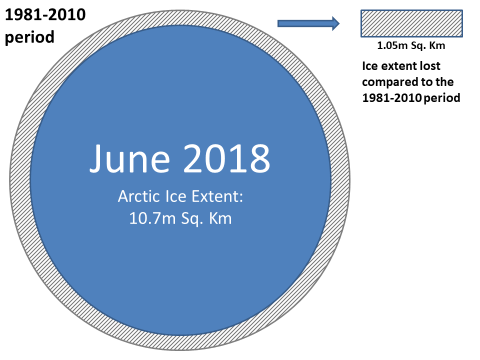
According to the National Snow and Ice Data Center (NSIDC), ice lost goes on in both poles … Arctic sea ice extent for June 2018 was the 4th lowest extent for the month in the satellite record. What about the Antarctic? Sea ice expanded at a faster-than-average pace in June in the Southern Hemisphere, bringing Antarctic sea ice extent closer to typical ice extents for this time of year. This follows on the heels of a period of below-average ice extent since austral winter in 2016.
Arctic sea ice extent for June 2018 averaged 10.7 million square kilometers (4.1 million square miles), the 4th lowest in the 1979 to 2018 satellite record. This was 1.05 million square kilometers (405,000 square miles) below the 1981 to 2010 average.
The linear rate of sea ice decline for December is 48,000 square kilometers (18,500 square miles) per year or 4.1 percent per decade.
Considering data from 2015 to 2018, we can see Arctic Ice Lost ranges from 750,000 Square kilometers in winter 2015 and 1.4 million Square Kilometers in summer 2016. Ice extent in June 2018 was above 2017 but below 2016, but it is clear that ice extent in the Arctic region has been constantly below the long term average.
Figure – Ice Extent Lost Is Increasing Over Time
(Quantity of Ice Extent Lost in December and June compared to the 1981-2010 average)
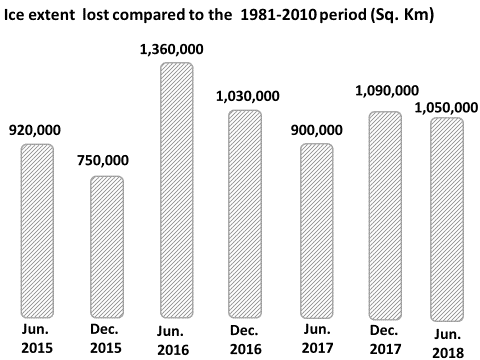
Source: LTEconomy on NSIDC
For further information, please see the article: ARCTIC MELTING: in December, Arctic sea ice extent 1,000,000 square kilometers below the 1981-2010 average on www.lteconomy.it
Conclusions
Data released by the most important world institutions confirm the persistence of an accelerated change in climatic conditions. The Global Risk Report 2018 by the World Economic Forum (WEO) places Climate Change among the top 5 risks in terms of impact and probability of occurrence: it has climbed positions after positions in recent years (D. Ruggiero, “Global Risk Report 2018: environmental and technological risks dominate the scenario “- www.lteconomy.it). Extreme weather events (from droughts to rainstorms in places not accustomed to them) have increased in frequency and intensity. Is it mere pessimism? Is it something we must be afraid of? No, it isn’t! All this must be tackled with healthy optimism: the time has come. Decisively our society must face the theme of ‘sustainability‘, drastically changing the economic and energy models on which it is based. We must reduce our Ecological Footprint with little effect on our material well-being (and it is possible with the current technological knowledge). Land, nature, human and cultural capital are the things to be protected, all this requires a long-term vision in institutions, businesses and citizens.
Dario Ruggiero
0
Tags :